A press release does not end when it goes live.
That is when the learning begins.
Too many businesses look at a distribution report, see a big number, and assume the campaign worked. Others see modest traffic and assume it failed. Both reactions can be wrong.
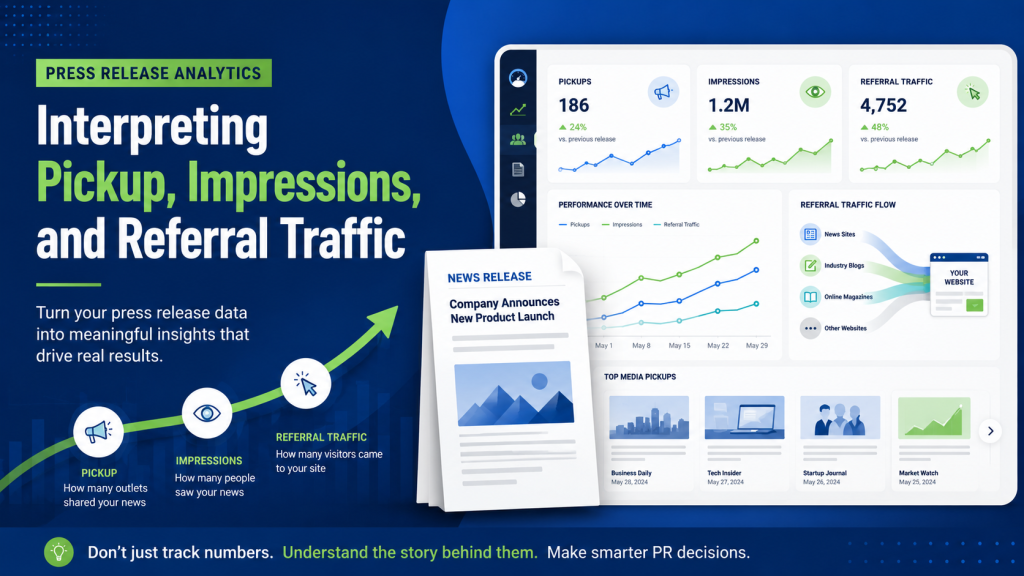
Press release analytics are useful only when you know what each number means. Pickup, impressions, and referral traffic each tell part of the story. None tells the whole story by itself.
The goal is not to chase the biggest number. It is to learn what happened, what mattered, and what to do next.
Pickup: Where Your Release Appeared
Pickup usually refers to the websites, news platforms, databases, and feeds where your press release was published or syndicated.
If your release appears on dozens or hundreds of websites, it feels like proof that the release got out there.
But pickup needs context.
Not all pickup is equal.
A release appearing on a general news or financial site is different from a reporter-written article in a trade publication. One is syndication. The other is earned media.
Syndicated pickup can help with visibility, credibility, and discoverability. That is why professional press release distribution matters: it helps your release reach the right media channels instead of simply sitting on a free submission site. It gives you live pages you can share with prospects, partners, investors, or your internal team. It can also help your company look active when someone searches your name.
Earned coverage carries more weight. That is when a journalist, editor, producer, blogger, or industry writer decides your story is worth covering in their own words.
When reviewing pickup, ask:
- Where did the release appear?
- Is the audience relevant?
- Did any pickup lead to original coverage, interviews, mentions, or inquiries?
A small number of relevant placements can beat a long list of random ones.
Impressions: Potential Exposure, Not Guaranteed Attention
Impressions are one of the most misunderstood PR metrics.
An impression usually estimates how many people could have seen your release or a page where it appeared. It does not mean every one of those people read it, clicked it, or remembered your company.
It means potential exposure.
That still matters, but it should be treated carefully.
Impressions can help you understand reach and compare one release to another. If one announcement earns far more potential exposure, that may tell you something about the strength of the topic, headline, timing, or industry interest.
But impressions are not the same as impact.
A billboard on a busy highway may generate thousands of impressions. That does not mean thousands of people took action. The same is true for press releases.
Use impressions as a directional metric, not a trophy.
If a product launch received strong pickup and high impressions but almost no referral traffic, the release may have reached people but failed to give them a strong reason to click. The headline may have been vague. The call to action may have been buried.
On the other hand, a release with lower impressions but strong referral traffic may indicate a better audience fit. Fewer people saw it, but the right people cared.
The quality of attention matters more than the size of the number.
Referral Traffic: What People Did Next
Referral traffic shows visits to your website from other sites that linked to or mentioned your release.
This is where PR analytics start to connect with business outcomes.
If your release links to your website, landing page, product page, event page, or media kit, referral traffic can show whether readers took the next step.
In Google Analytics4, the Traffic acquisition report is a useful place to review where visitors came from and compare referral traffic against other channels.
Ask:
- Which sources sent visitors?
- How many visitors came from each source?
- How long did they stay?
- Did they visit more than one page?
- Did they fill out a form, register, buy, request a demo, or contact you?
This is where many businesses miss the point. They ask, “How much traffic did we get?”
A better question is, “What kind of traffic did we get?”
Twenty visits from a niche publication can be more valuable than 2,000 visits from a broad site if those 20 visitors are serious prospects.
Use UTM Links to Reduce Guesswork
If you want cleaner analytics, use UTM links.
A UTM link is a trackable version of a URL. It helps you see which campaign drove traffic.
For a press release, tag your main link with a campaign name such as press_release_product_launch_may_2026. Then keep a simple spreadsheet with the release date, headline, link, campaign name, and landing page.
Without UTM tracking, you may see a traffic spike and wonder what caused it. With it, you can connect visits to a specific release.
Connect the Metrics
The real value comes when you read the metrics together.
Pickup tells you where the release appeared.
Impressions tell you the possible scale of exposure.
Referral traffic tells you who acted.
Conversions tell you whether that action created business value.
Think of it like a chain: distribution creates availability, pickup creates visibility, impressions suggest reach, referral traffic shows response, and conversions show outcome.
A weak result at one stage may simply show where the next improvement should happen.
If pickup is strong but traffic is weak, improve your headline, angle, links, and call to action.
If traffic is strong but conversions are weak, improve the landing page.
If impressions are high but engagement is low, tighten the audience and make the story more specific.
If earned coverage happens but website traffic is limited, remember that PR also builds credibility. Some people will read, search your name later, or come back weeks after the original coverage.
Look for Patterns Over Time
One release gives you a snapshot. Several releases give you a pattern.
Track every release in a simple scorecard. Include the date, headline, topic, audience, pickup, notable placements, impressions, referral traffic, leads, sales inquiries, social mentions, and journalist responses.
After five or six releases, you will start to see what works. Maybe customer stories outperform product updates. Maybe survey data earns more trade coverage. Maybe your best referral traffic comes from niche blogs.
PR gets better when you stop treating each release as a one-time event and start treating it as market feedback.
What to Do After You Review the Numbers
Once you have the analytics, do something with them.
Use this simple post-release process:
- Save the distribution and pickup report.
- Identify the most relevant placements.
- Check referral traffic and conversions.
- Note journalist replies or media inquiries.
- Share strong placements with your sales team.
- Repurpose the news into email, social posts, blog content, and investor updates.
- Record lessons for the next release.
Every release should make the next one sharper.
The Bottom Line
Press release analytics are not about proving that every announcement changed the world. They are about understanding what happened.
Pickup shows where your release appeared. Impressions show potential reach. Referral traffic shows response. Conversions show whether the release helped move people closer to trust, interest, or action.
Read the numbers like clues. Over time, they show which stories people care about and which audiences respond.

Mickie Kennedy founded eReleases.com in 1998 after watching PR firms charge small businesses a $20,000 minimum for a single press release. For 27 years, he’s been closing that gap — distributing 150,000+ releases via Cision PR Newswire, serving 30,000+ clients including Manscaped, Squatty Potty, and 40+ Shark Tank brands, and generating $132M+ in earned media. A sought-after podcast guest and two-time Amazon bestselling author of Beginner’s Guide to Writing Powerful Press Releases and The PR Strategy Manifesto. Mickie holds an MFA in Creative Writing from George Mason University. Based in Baltimore, MD. LinkedIn